import matplotlib.pyplot as plt
import numpy as np
from scipy.integrate import quad
from scipy.special import exp1

import ttim

plt.rcParams["font.size"] = 8.0
plt.rcParams["figure.figsize"] = (8, 3)
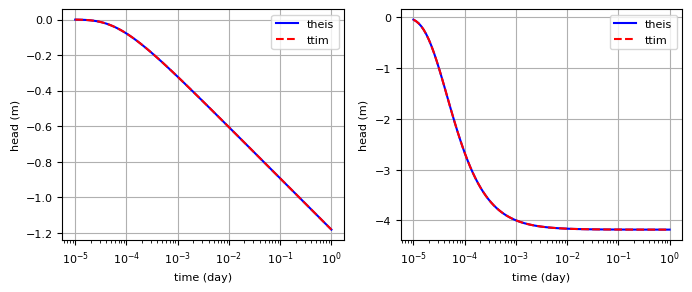
Theis#
def theis(r, t, T, S, Q):
    u = r**2 * S / (4 * T * t)
    h = -Q / (4 * np.pi * T) * exp1(u)
    return h


def theisQr(r, t, T, S, Q):
    u = r**2 * S / (4 * T * t)
    return -Q / (2 * np.pi) * np.exp(-u) / r
T = 500
S = 1e-4
t = np.logspace(-5, 0, 100)
r = 30
Q = 788
htheis = theis(r, t, T, S, Q)
Qrtheis = theisQr(r, t, T, S, Q)
ml = ttim.ModelMaq(kaq=25, z=[20, 0], Saq=S / 20, tmin=1e-5, tmax=1)
w = ttim.Well(ml, tsandQ=[(0, Q)], rw=1e-5)
ml.solve()
h = ml.head(r, 0, t)
Qx, Qy = ml.disvec(r, 0, t)
self.neq  1
solution complete
plt.subplot(121)
plt.semilogx(t, htheis, "b", label="theis")
plt.semilogx(t, h[0], "r--", label="ttim")
plt.xlabel("time (day)")
plt.ylabel("head (m)")
plt.legend()
plt.grid()
plt.subplot(122)
plt.semilogx(t, Qrtheis, "b", label="theis")
plt.semilogx(t, Qx[0], "r--", label="ttim")
plt.xlabel("time (day)")
plt.ylabel("head (m)")
plt.legend(loc="best")
plt.grid()
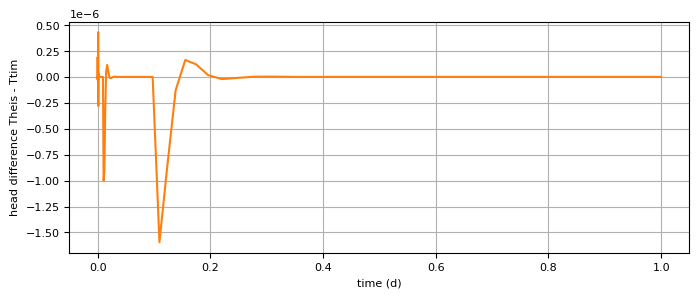
def test(M):
    ml = ttim.ModelMaq(kaq=25, z=[20, 0], Saq=S / 20, tmin=1e-5, tmax=1, M=M)
    ttim.Well(ml, tsandQ=[(0, Q)], rw=1e-5)
    ml.solve(silent=True)
    h = ml.head(r, 0, t)
    return htheis - h[0]
enumba = test(M=10)
plt.plot(t, enumba, "C1")
plt.xlabel("time (d)")
plt.ylabel("head difference Theis - Ttim")
plt.grid()
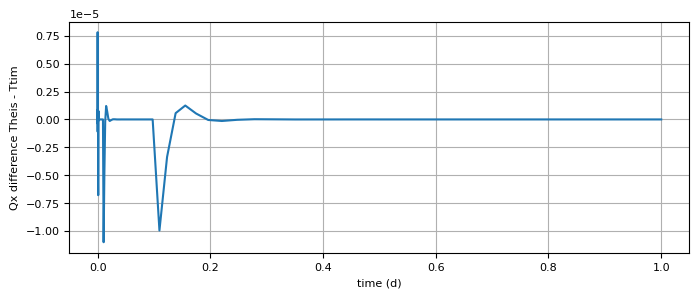
plt.plot(t, Qrtheis - Qx[0])
plt.xlabel("time (d)")
plt.ylabel("Qx difference Theis - Ttim")
plt.grid()
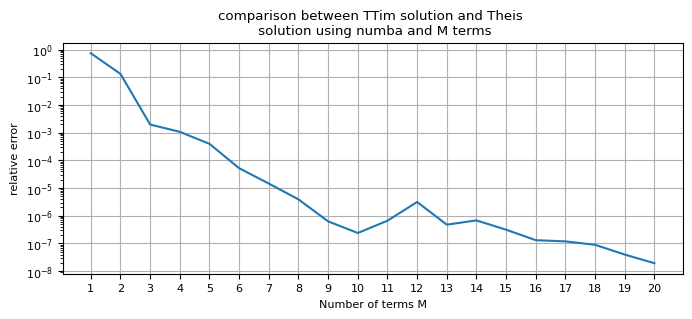
def compare(M=10):
    ml = ttim.ModelMaq(kaq=25, z=[20, 0], Saq=S / 20, tmin=1e-5, tmax=1, M=M)
    ttim.Well(ml, tsandQ=[(0, Q)], rw=1e-5)
    ml.solve(silent=True)
    h = ml.head(r, 0, t)
    rmse = np.sqrt(np.mean((h[0] - htheis) ** 2))
    return rmse


Mlist = np.arange(1, 21)
rmse = np.zeros(len(Mlist))
for i, M in enumerate(Mlist):
    rmse[i] = compare(M)
plt.semilogy(Mlist, rmse)
plt.xlabel("Number of terms M")
plt.xticks(np.arange(1, 21))
plt.ylabel("relative error")
plt.title(
    "comparison between TTim solution and Theis \n solution using numba and M terms"
)
plt.grid()
def volume(r, t=1):
    return -2 * np.pi * r * ml.head(r, 0, t) * ml.aq.Scoefaq[0]


quad(volume, 1e-5, np.inf)
(788.0000039400175, 2.2165656353072968e-07)
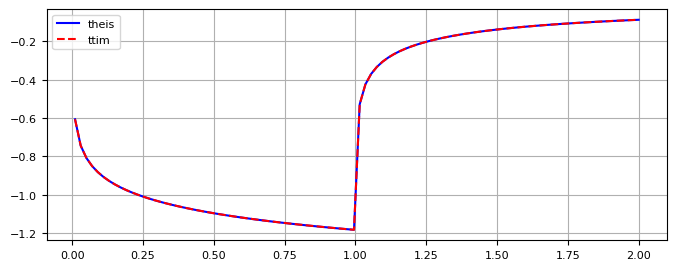
def theis2(r, t, T, S, Q, tend):
    u1 = r**2 * S / (4 * T * t)
    u2 = r**2 * S / (4 * T * (t[t > tend] - tend))
    h = -Q / (4 * np.pi * T) * exp1(u1)
    h[t > tend] -= -Q / (4 * np.pi * T) * exp1(u2)
    return h
ml2 = ttim.ModelMaq(kaq=25, z=[20, 0], Saq=S / 20, tmin=1e-5, tmax=10)
w2 = ttim.Well(ml2, tsandQ=[(0, Q), (1, 0)])
ml2.solve()
self.neq  1
solution complete
t2 = np.linspace(0.01, 2, 100)
htheis2 = theis2(r, t2, T, S, Q, tend=1)
h2 = ml2.head(r, 0, t2)
plt.plot(t2, htheis2, "b", label="theis")
plt.plot(t2, h2[0], "r--", label="ttim")
plt.legend(loc="best")
plt.grid()
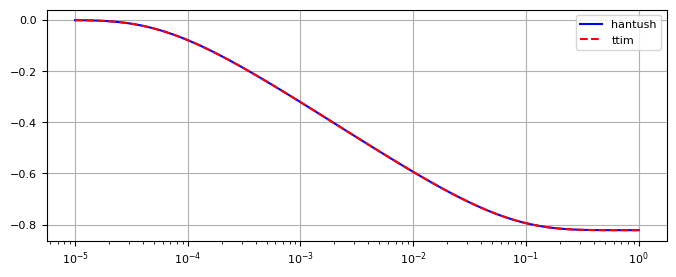
Hantush#
T = 500
S = 1e-4
c = 1000
t = np.logspace(-5, 0, 100)
r = 30
Q = 788
from scipy.integrate import quad


def integrand_hantush(y, r, lab):
    return np.exp(-y - r**2 / (4 * lab**2 * y)) / y


def hantush(r, t, T, S, c, Q, tstart=0):
    lab = np.sqrt(T * c)
    u = r**2 * S / (4 * T * (t - tstart))
    F = quad(integrand_hantush, u, np.inf, args=(r, lab))[0]
    return -Q / (4 * np.pi * T) * F


hantushvec = np.vectorize(hantush)
ml = ttim.ModelMaq(
    kaq=25, z=[21, 20, 0], c=[1000], Saq=S / 20, topboundary="semi", tmin=1e-5, tmax=1
)
w = ttim.Well(ml, tsandQ=[(0, Q)])
ml.solve()
self.neq  1
solution complete
hhantush = hantushvec(30, t, T, S, c, Q)
h = ml.head(r, 0, t)
plt.semilogx(t, hhantush, "b", label="hantush")
plt.semilogx(t, h[0], "r--", label="ttim")
plt.legend(loc="best")
plt.grid()
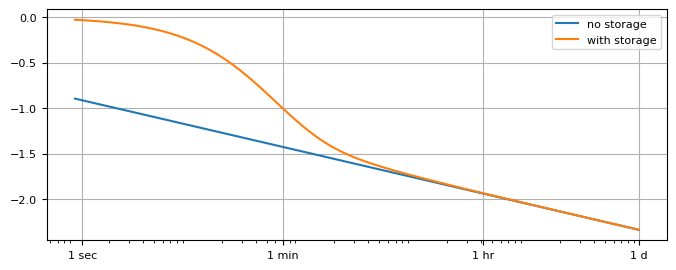
Well with welbore storage#
T = 500
S = 1e-4
t = np.logspace(-5, 0, 100)
rw = 0.3
Q = 788

ml = ttim.ModelMaq(kaq=25, z=[20, 0], Saq=S / 20, tmin=1e-5, tmax=1)
w = ttim.Well(ml, rw=rw, tsandQ=[(0, Q)])
ml.solve()
hnostorage = ml.head(rw, 0, t)

ml = ttim.ModelMaq(kaq=25, z=[20, 0], Saq=S / 20, tmin=1e-5, tmax=1)
w = ttim.Well(ml, rw=rw, tsandQ=[(0, Q)], rc=rw)
ml.solve()
hstorage = ml.head(rw, 0, t)

plt.semilogx(t, hnostorage[0], label="no storage")
plt.semilogx(t, hstorage[0], label="with storage")
plt.legend(loc="best")
plt.xticks(
    [1 / (24 * 60 * 60), 1 / (24 * 60), 1 / 24, 1], ["1 sec", "1 min", "1 hr", "1 d"]
)
plt.grid()
self.neq  1
solution complete
self.neq  1
solution complete
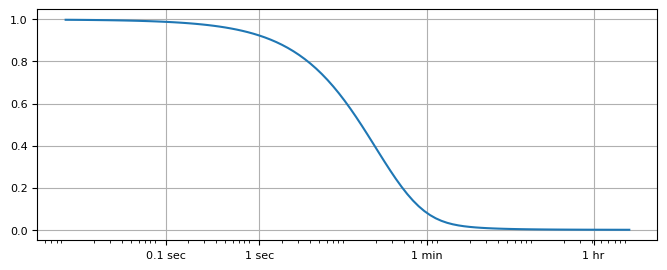
Slug test#
k = 25
H = 20
S = 1e-4 / H
t = np.logspace(-7, -1, 100)
rw = 0.2
rc = 0.2
delh = 1
ml = ttim.ModelMaq(kaq=k, z=[H, 0], Saq=S, tmin=1e-7, tmax=1)
Qslug = np.pi * rc**2 * delh
w = ttim.Well(ml, tsandQ=[(0, -Qslug)], rw=rw, rc=rc, wbstype="slug")
ml.solve()
h = w.headinside(t)
plt.semilogx(t, h[0])
plt.xticks(
    [1 / (24 * 60 * 60) / 10, 1 / (24 * 60 * 60), 1 / (24 * 60), 1 / 24],
    ["0.1 sec", "1 sec", "1 min", "1 hr"],
)
plt.grid()
self.neq  1
solution complete
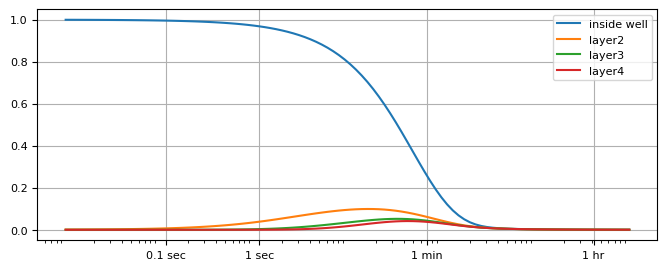
Slug test in 5-layer aquifer#
Well in top 2 layers
k = 25
H = 20
Ss = 1e-4 / H
t = np.logspace(-7, -1, 100)
rw = 0.2
rc = 0.2
delh = 1
ml = ttim.Model3D(kaq=k, z=np.linspace(H, 0, 6), Saq=Ss, tmin=1e-7, tmax=1)
Qslug = np.pi * rc**2 * delh
w = ttim.Well(ml, tsandQ=[(0, -Qslug)], rw=rw, rc=rc, layers=[0, 1], wbstype="slug")
ml.solve()
hw = w.headinside(t)
plt.semilogx(t, hw[0], label="inside well")
h = ml.head(0.2 + 1e-8, 0, t)
for i in range(2, 5):
    plt.semilogx(t, h[i], label="layer" + str(i))
plt.legend()
plt.xticks(
    [1 / (24 * 60 * 60) / 10, 1 / (24 * 60 * 60), 1 / (24 * 60), 1 / 24],
    ["0.1 sec", "1 sec", "1 min", "1 hr"],
)
plt.grid()
self.neq  2
solution complete
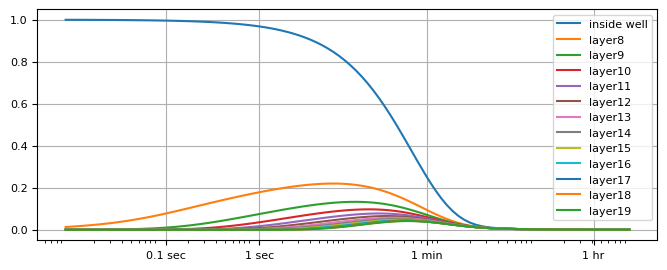
20 layers
k = 25
H = 20
S = 1e-4 / H
t = np.logspace(-7, -1, 100)
rw = 0.2
rc = 0.2
delh = 1
ml = ttim.Model3D(kaq=k, z=np.linspace(H, 0, 21), Saq=S, tmin=1e-7, tmax=1)
Qslug = np.pi * rc**2 * delh
w = ttim.Well(ml, tsandQ=[(0, -Qslug)], rw=rw, rc=rc, layers=np.arange(8), wbstype="slug")
ml.solve()
hw = w.headinside(t)
plt.semilogx(t, hw[0], label="inside well")
h = ml.head(0.2 + 1e-8, 0, t)
for i in range(8, 20):
    plt.semilogx(t, h[i], label="layer" + str(i))
plt.legend()
plt.xticks(
    [1 / (24 * 60 * 60) / 10, 1 / (24 * 60 * 60), 1 / (24 * 60), 1 / 24],
    ["0.1 sec", "1 sec", "1 min", "1 hr"],
)
plt.grid()
self.neq  8
solution complete
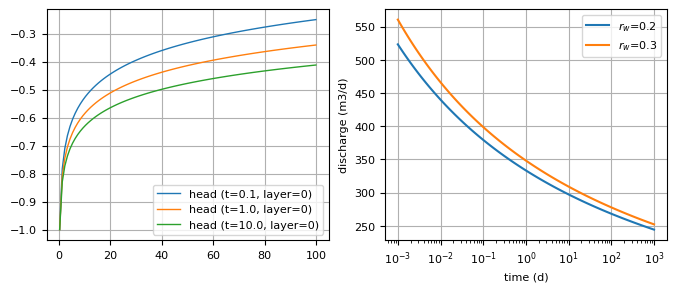
Head Well#
ml = ttim.ModelMaq(kaq=25, z=[20, 0], Saq=1e-5, tmin=1e-3, tmax=1000)
w = ttim.HeadWell(ml, tsandh=[(0, -1)], rw=0.2)
ml.solve()
ax0 = plt.subplot(1, 2, 1)
ml.plots.head_along_line(0.2, 100, 0, 0, 100, t=[0.1, 1, 10], sstart=0.2, ax=ax0)
t = np.logspace(-3, 3, 100)
dis = w.discharge(t)
ax1 = plt.subplot(1, 2, 2)
plt.semilogx(t, dis[0], label="$r_w$=0.2")
ml = ttim.ModelMaq(kaq=25, z=[20, 0], Saq=1e-5, tmin=1e-3, tmax=1000)
w = ttim.HeadWell(ml, tsandh=[(0, -1)], rw=0.3)
ml.solve()
dis = w.discharge(t)
plt.semilogx(t, dis[0], label="$r_w$=0.3")
plt.xlabel("time (d)")
plt.ylabel("discharge (m3/d)")
ax0.legend()
ax1.legend()
ax1.grid()
self.neq  1
solution complete
self.neq  1
solution complete